Con Kenneth Richard – 22 settembre 2016
A partire da metà settembre, ci sono già state 77 nuove pubblicazioni scientifiche peer-reviewed scritte da diverse centinaia di scienziati che collegano l’attività solare ai cambiamenti climatici. Ci sono state 43 nuove pubblicazioni scientifiche peer-reviewed a partire dalla fine di giugno, come possiamo vedere qui. In altre parole, ci sono state 34 nuove pubblicazioni scientifiche peer-reviewed che collegano il forcing solare ai cambiamenti climatici messi a disposizione on-line solo a luglio.
Questo tasso di pubblicazione per il 2016 è leggermente più alto del ritmo dei lavori pubblicati che collegano il forcing solare ai cambiamenti climatici del 2015 (95 carte Sole-clima) e 2014 (93 carte Sole-clima). Di questo passo, è probabile che un elenco di oltre 300 articoli scientifici che collegano il forcing solare ai cambiamenti climatici sarà stato messo a disposizione tra il 2014 e il 2016.
In aggiunta, ci sono già 41 lavori pubblicati su riviste scientifiche di quest’anno che collegano le oscillazioni oceaniche naturali (ad esempio, ENSO, NAO, AMO, PDO) ai cambiamenti climatici. Esistevano già 27 di tali documenti a partire dalla fine di giugno.
Il collegamento dell’oscillazione tra clima sole e oceano ha guadagnato l’accettazione diffusa nella comunità scientifica. Ad esempio, vedere “che 35 nuove pubblicazioni scientifiche confermano che i cicli oceanici e quelli solari sono i driver principali del clima”
Gli ultimi documenti che collegano l’attività solare così come le oscillazioni oceaniche ai cambiamenti climatici sono elencati di seguito. Non solo questi documenti descrivono l’attività solare e le oscillazioni oceaniche come i meccanismi dominanti dei cambiamenti climatici, di cui forniscono la prova che il post-1950 periodo moderno, non è stato il periodo con le temperature più alte degli ultimi cento anni. In realtà, questi documenti dimostrano che le temperature in alcuni periodi tra il 1700 e il 1800 erano altrettanto caldi o addirittura più caldi delle temperature attuali.
Che i periodi con concentrazioni di CO2 molto più basse (di circa 280 parti per milione, o lo 0,028% del gas atmosferico) potrebbero provocare temperature più alte che in questo momento (con concentrazioni di CO2 presenti che raggiungono le 400 parti per milione) sfidano le affermazioni che le variazioni di CO2 in primo luogo (o addirittura esclusivamente) determinano la temperatura dell’acqua del pianeta o dell’aria, e che le variazioni naturali dell’attività solare, la distribuzione del calore oceanico, delle nuvole e dell’attività vulcanica … giocano un piccolo o nessun ruolo nei cambiamenti climatici a lungo termine.
Forse questo paradigma sulla CO2-drives-climate deve essere aggiornato per riflettere sulle crescenti evidenze scientifiche che il sole e gli oceani sono in primo luogo ciò che guidano le variazioni della temperatura – non la CO2.
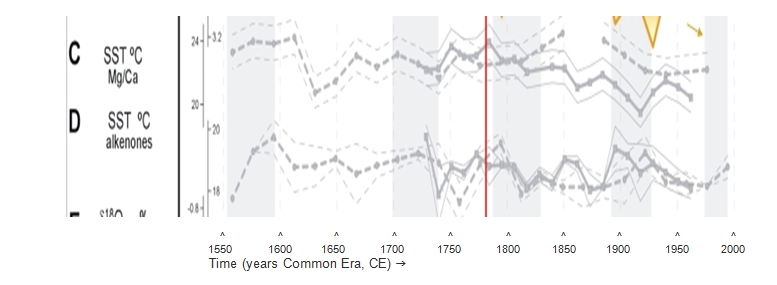
1. Incarbona et al., 2016 (Sicily, Aegean Sea)
Comparison between the records and multi-decadal atmospheric circulation patterns and climatic external forcings indicates that Mediterranean circulation destabilisation occurs during positive North Atlantic Oscillation (NAO) and negative Atlantic Multidecadal Oscillation (AMO) phases, reduced solar activity and strong tropical volcanic eruptions. They may have recurrently produced favourable deep-water formation conditions, both increasing salinity and reducing temperature on multi-decadal time scales.
[B]oth NAO and AMO are of importance for the Mediterranean climate variability. In particular, at multidedacal scales, positive NAO phases lead to decreased precipitation (i.e. higher salinity) while negative AMO leads to reduced SSTs. Both processes may have favoured deep-water formation events on relatively long time scales.
Thermohaline circulation destabilisations in the Mediterranean circulation also seem to be linked to reduced solar activity (ref. 40; Fig. 4D) and to frequent volcanic eruptions (ref. 41; Fig. 4E). Solar activity modulates patterns in surface temperature and pressure that resemble NAO phases, through dynamical coupling processes between the stratosphere and the troposphere that transmit the solar signal to the Earth’s surface. The increase in sulphur aerosols from tropical volcanic emissions produces stratospheric and surface conditions that resemble the positive NAO phase and cause decrease in oceanic heat content, with long-lived temperature anomalies extending to the mid-depth and deep ocean, an increase in sea ice volume and enhancement in the overturning circulation of the North Atlantic Ocean following these eruptions. These phenomena may have shaped the North Atlantic atmospheric pattern, which in turn may have led to Aegean SSTs cooling and thus surface buoyancy loss and enhanced Eastern Mediterranean deep-water formation during EMT-like events.
2. Lyu et al., 2016 (China)
The reconstructed April–July MMT series exhibited six cold and seven warm periods. The longest cold period lasted from AD 1645 to 1677 (33 years), with an average temperature of 0.5 ◦C below the mean value. The longest warm period, however, lasted from AD 1767 to 1785 (19 years), and the average temperature was 0.69 ◦C above the mean value (Table 4). Four cold (1605–1616, 1645–1677, 1911–1924, and 1951–1969) and warm (1795–1807, 1838– 1848, 1856–1873, and 1991–2008) periods were consistent with other results of tree-ring reconstructions in northeast China (Shao and Wu, 1997; Yin et al., 2009; Wang et al., 2012; Zhu et al., 2015). In addition, two cold periods (1645– 1677 and 1684–1691) were consistent with the Maunder Minimum (1645–1715), an interval of decreased solar irradiance (Bard et al., 2000). … The three temperature series exhibited significantly low temperature periods during the 1950s–1970s, which coincided with a slight decrease in solar activity from AD 1940 to 1970 (Beer et al., 2000; Fig. 7).
[P]revious studies suggest that climate change in northeast China was also linked to the solar activities and global land–sea atmospheric circulation during certain pre-instrumental periods (Chen et al., 2006; Wang et al., 2011; Liu et al., 2013). It is generally accepted that the climate warms during periods of strong solar activity (e.g., the Medieval Warm Period) and cools during periods of low solar activity (e.g., the Little Ice Age; Lean and Rind, 1999; Bond et al., 2001).
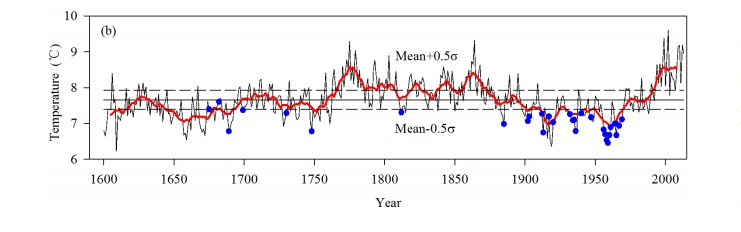
“Reconstruction of April-July minimum temperature on Laobai Mountain for the last 414 years [1600-2014]. The smoothed line indicates the 11-year moving average, and blue dots represent minimum freezing events.”
3. Sunkara and Tiwari, 2016 (India)
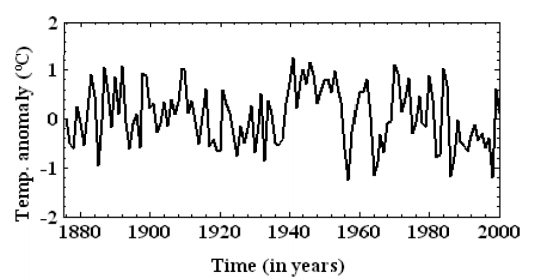
To study the imprints of the solar–ENSO–geomagnetic activity on the Indian subcontinent, we have applied singular spectral analysis (SSA) and wavelet analysis to the tree-ring temperature variability record from the Western Himalayas. Other data used in the present study are the solar sunspot number (SSN), geomagnetic indices (aa index), and the Southern Oscillation Index (SOI) for the common time period of 1876–2000. Both SSA and wavelet spectral analyses reveal the presence of 5–7-year short-term ENSO variations and the 11-year solar cycle, indicating the possible combined influences of solar–geomagnetic activities and ENSO on the Indian temperature. Another prominent signal corresponding to 33-year periodicity in the tree-ring record suggests the Sun-temperature variability link probably induced by changes in the basic state of the Earth’s atmosphere. In order to complement the above findings, we performed a wavelet analysis of SSA reconstructed time series, which agrees well with our earlier results and increases the signal-to-noise ratio, thereby showing the strong influence of solar–geomagnetic activity and ENSO throughout the entire period. The solar flares are considered responsible for causing the atmospheric circulation patterns. The net effect of solar–geomagnetic processes on the temperature record might suggest counteracting influences on shorter (about 5–6-year) and longer (about 11–12-year) timescales. The present analyses suggest that the influence of solar activities on the Indian temperature variability operates in part indirectly through coupling of ENSO on multilateral timescales. The analyses, hence, provide credible evidence of teleconnections of tropical Pacific climatic variability and Indian climate ranging from inter-annual to decadal timescales and also suggest the possible role of exogenic triggering in reorganizing the global Earth–ocean–atmospheric systems.
4. Zhu et al., 2016 (China)
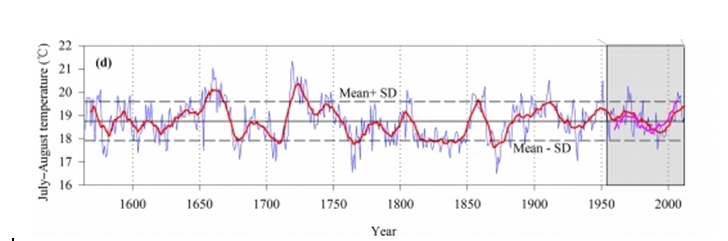
A 368-year maximum temperature reconstruction
During the period 1875–1955, late summer temperature fluctuated less strongly than before or thereafter. In general, the average length of cold periods was shorter than that of warm periods. The cold period of 1869–1877 was the longest and coldest cool period had a mean of 17.63°C. The longest warm period extended from 1655 to 1668, and the warmest period in AD 1719–1730 had a mean of 20.37°C. However, we should point out that the rapid warming during the 20th century was not especially obvious in our reconstructed RLST.
[S]even cold periods and three warm periods were identified during the past 368 years (Fig. 4d). All the cold periods were during the Maunder (1708–1711) or Dalton (1818– 1821, 1824–1828, 1832–1836, and 1839–1842) solar minima periods, except for the cold periods of 1765–1769 and 1869–1877 (Eddy, 1976; Shindell et al., 1999), which indicated that RLST [mean maximum temperature] variations in the NWSP [northwestern Sichuan Plateau, China ] might be driven by solar activity (Fig. 7b). On the other hand, volcanic eruptions in the corresponding periods might also be a cooling factor (Fig. 7b). A longer cold period (e.g., 1820s–1840s) was interrupted by transient warming, thus forming a plurality of discontinuous short cold periods. Warm periods of 1719–1730 and 1858–1859 both had more sunspots (Eddy, 1976; Shindell et al., 1999) and lower volcanic forcing (Fig. 7b). The cold (1765–1769 or 1869–1877) and warm (1655–1668) periods were highly consistent with other studies (Fig. 7).
Possible Forcing Mechanism
Accompanied by significant peaks at 60.2 and 73 years, the continuously periodicities around 49–114 years in our regional temperature reconstruction might tentatively be related to PDO, Atlantic Multidecadal Oscillation (AMO; En- field et al., 2001) as well as solar activity (Eddy, 1976; Shindell et al., 1999; Peristykh and Damon, 2003; Raspopov et al., 2004; Braun et al., 2005). The AMO was an important driver of multidecadal variations in summer climate not only in North America and western Europe (Kerr, 2000; Sutton and Hodson, 2005) but also in the East Asia (Feng and Hu, 2008; Liang et al., 2008; Wang et al., 2011, 2015; Zhu et al., 2011). The 60.2-year peak associated with AMO demonstrated that multidecadal variations in late summer temperature in the NWSP NWSP [northwestern Sichuan Plateau, China] might be controlled by AMO.
[S]ignificant multidecadal- and centennial-scale cycles of our temperature reconstruction might include the signs of solar activity, such as the Gleissberg cycles (Peristykh and Damon, 2003), Suess cycles (Braun et al., 2005), Bruckner cycles (Raspopov et al., 2004), and Schwabe cycles (Braun et al., 2005). The Maunder (ca. AD 1645–1715) and Dalton (ca. AD 1790–1840) solar minima periods were generally associated with temperature depressions (Eddy, 1976), and the Damon (ca. AD 1890– 1920) solar maximum period occurred in a relatively warm period, which further confirmed that late summer temperature variation in the NWSP [northwestern Sichuan Plateau, China] might be driven by solar activity (Fig. 7b).
Conclusion: Overall, the RLST [mean maximum temperature] variability in the NWSP [northwestern Sichuan Plateau, China ] might be associated with global land–sea atmospheric circulation (e.g., ENSO, PDO, or AMO) as well as solar and volcanic forcing.
Fonte: notrickszone
Enzo
Attività Solare


